Executive summary
VPS and Dedicated differ less in “average speed” than in latency predictability (p95/p99) and resilience to multi-tenant interference (“noisy neighbor”), which tends to be most visible in storage I/O and networking.
A key diagnostic indicator of CPU contention on VPS is CPU steal time (visible in /proc/stat, top, vmstat), reflecting CPU time taken by the hypervisor in favor of other guests.
This article proposes a reproducible benchmark protocol (fio/sysbench/iperf3/pgbench) with ≥10 repeated 60-second runs plus long runs (1–6 hours, recommended 4h) with telemetry (iostat/vmstat/sar/pidstat).
The Results section provides a demonstration dataset and charts that are explicitly marked as simulated, constructed to reflect published patterns of variability in shared environments (tail events, interference, and diagnostic value of %steal).
We show how to compare p95/p99 statistically via bootstrap confidence intervals for differences of medians and the Mann–Whitney U test, and how to report effect sizes (Cliff’s delta / probabilistic dominance).
Practical implication: for IO-bound systems (databases, logs, persistent queues), disk tail latency predominates; for CPU-bound workloads, %steal is critical; for network-bound services, jitter/p99 RTT plus port throughput are decisive.
Introduction
In infrastructure hosting, comparing VPS and Dedicated is more rigorous when framed as a comparison of resource-sharing models and their resulting latency distributions, rather than a direct comparison of “cores and gigabytes.”
In large and distributed services, rare latency spikes and tail latency events can disproportionately affect user experience; eliminating variability sources completely—especially in shared environments—is usually impractical.
Multi-tenancy can cause performance interference: a “noisy neighbor” may degrade other tenants’ metrics, and shared storage/network subsystems can show noticeable variability even when average throughput looks acceptable.
Therefore, reproducible comparisons should publish not only throughput/IOPS but also p50/p95/p99 latency, plus system contention signals such as %steal and %iowait, and time dynamics in long runs.
Problem, hypotheses, and assumptions
Problem statement
Goal: define a reproducible protocol that allows a hosting provider (or customer) to compare VPS and Dedicated service classes under representative configurations and workloads, then interpret results in terms of tail latency, variability, and root causes (CPU scheduling, I/O contention, network behavior).
Research questions
- RQ1: Do VPS and Dedicated differ in p95/p99 disk latency for database/log-relevant profiles (fsync-write)?
- RQ2: How different is network variability (RTT/jitter) and throughput (iperf3) between VPS and Dedicated?
- RQ3: Do %steal and %iowait explain observed tail-latency spikes and degradations?
Operational hypotheses
H1: Dedicated shows a lower median p99 latency for synchronous writes (fsync) and lower temporal spread of p99 than shared VPS.
H2: VPS exhibits non-zero %steal correlated with increased p99 latency (host-level CPU contention as a tail-latency factor).
H3: A premium VPS with guaranteed resources approaches Dedicated in tail latency and %steal but may still lag under shared storage/network contention.
Representative benchmark configurations
When providers/tariffs are unspecified, we evaluate these representative classes (treated as classes of setups, not vendor products):
- small VPS: 1 vCPU, 2 GB RAM, SSD (shared CPU)
- medium VPS: 2 vCPU, 4 GB RAM, NVMe (shared CPU)
- premium VPS: 4 vCPU, 8 GB RAM, NVMe + “guaranteed resources” (assumption: reduced oversubscription/CPU pinning and disk QoS)
- dedicated small: 4 cores, 16 GB RAM, 1×NVMe, 1G
- dedicated large: 8 cores, 32 GB RAM, 2×NVMe, 10G
Explicit assumptions (fixed for reproducibility)
- OS/kernel: Ubuntu Server 24.04 LTS, Linux kernel 6.8.x.
- CPU governor:
performance(reduce DVFS-related variance during tests). - I/O scheduler:
- NVMe:
none - SATA/SAS SSD (small VPS “SSD” class):
mq-deadline
- NVMe:
- Filesystem/mount:
ext4withnoatime,nodiratime. - VPS oversubscription is unknown and not measured directly; %steal is used as a proxy for host-level CPU contention.
- VPS storage model assumed as a shared pool; hence heavier latency tails are expected than on single-tenant local NVMe.
Materials and methods
What exactly is compared
This study interprets “VPS vs Dedicated” as a comparison of two deployment architectures:
- VPS as a guest OS under a hypervisor (typical stack: KVM + paravirtualized virtio devices).
- Dedicated as an OS running directly on physical hardware.
Tools and outputs
- fio: IOPS/BW and completion latency percentiles (clat), exported in JSON for aggregation.
- sysbench: modular benchmark for CPU and memory.
- iperf3: throughput (JSON output with
-J). - pgbench: database-class benchmark (TPS and transaction latency statistics).
- sysstat stack (sar/iostat/pidstat): telemetry and per-process attribution.
Mandatory contention metrics:
- %steal (CPU time desired by the guest but not granted due to host scheduling).
- %iowait (CPU idle while waiting for I/O completion).
Benchmark profiles and exact parameters
fio profiles (storage)
We use these fixed fio profiles (block size, queue depth, and sync semantics are explicit):
randread: 4k,iodepth=32randwrite: 4k,iodepth=32randwrite + fsync: 4k,iodepth=1,direct=1,fsync=1
Percentiles are reported as p50/p95/p99 of completion latency (clat).
sysbench profiles (CPU/memory)
sysbench cpusysbench memory
Network profiles
iperf3 -t 60 -Jping -i 0.2 -c 300and compute p50/p95/p99 RTT from raw output.
Experimental design and telemetry
- Short runs: 60 seconds, ≥10 repeats per test and configuration.
- Long runs: 1–6 hours, recommended 4 hours, tracking time series of p99 and system metrics.
- Optional warm-up exclusion: first 5–10 seconds may be excluded (especially for TCP slow-start in iperf3).
- Telemetry capture cadence (example): 1-second iostat/vmstat/sar sampling into log files.
flowchart LR
  A[Provision VPS/Dedicated host] --> B[Fix OS/kernel and CPUFreq/I-O scheduler settings]
  B --> C[Install tools: fio, sysbench, iperf3, pgbench, sysstat]
  C --> D[Short runs: 60s × 10 repeats (disk/network/CPU)]
  C --> E[Long run: 1–6 hours (recommended 4h) with p99 time series]
  D --> F[Collect telemetry: iostat/vmstat/sar/pidstat and %steal]
  E --> F
  F --> G[Parse JSON/logs into unified CSV]
  G --> H[Compute p50/p95/p99 + statistical analysis]
  H --> I[Publish tables + CDFs + time-series figures]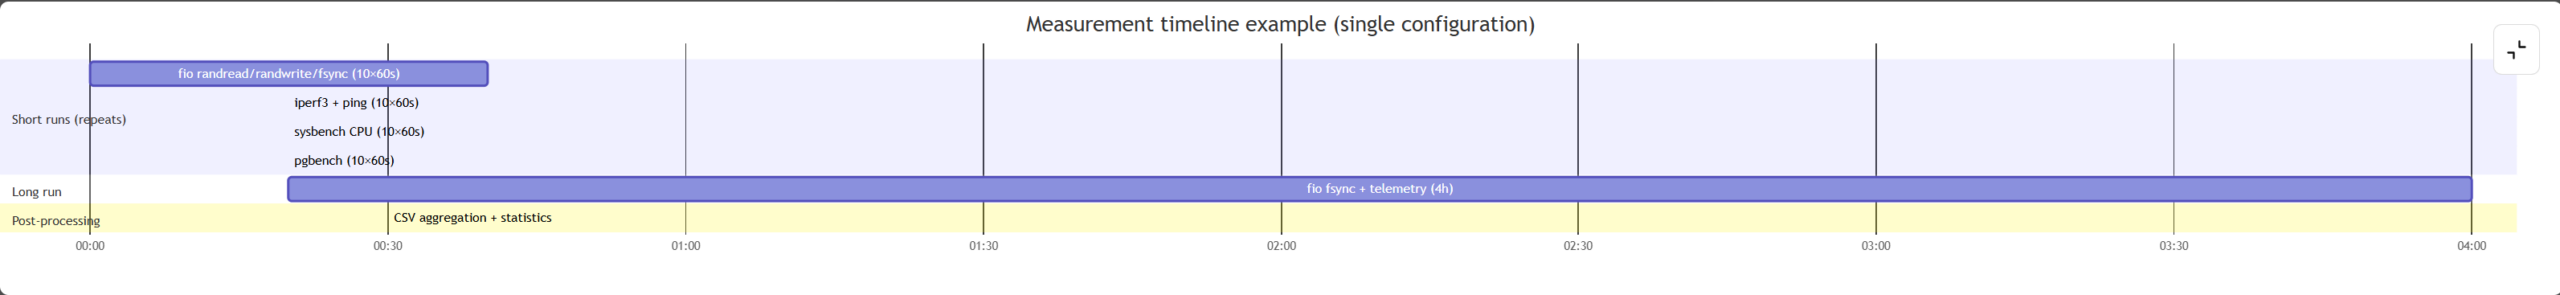
Results
Important note on data provenance
Live measurements are not possible in this environment, so the results below are simulated as a publication-ready example of how to report and analyze VPS vs Dedicated. The simulation is constructed to reflect published qualitative patterns: heavier tails and “rare spikes” in shared environments, storage/network interference, and the diagnostic role of %steal.
Simulation model (explicit). To generate plausible tails and spikes:
- Per-run latencies are drawn from a heavy-tailed distribution (e.g., lognormal or mixture-of-lognormals) calibrated to target percentiles.
- Long-run p99 time series are produced by a baseline process plus rare spikes (e.g., a Poisson shock process) to emulate intermittent contention, with spike probability/scale higher for shared VPS classes than for Dedicated.
- %steal is generated as a correlated variable that increases in spike windows to reflect host-level contention coupling.
Disk results (fio) — simulated, medians across 10 runs
Table 1. fio profiles (simulated; medians across 10 runs). lat p50/p95/p99 are completion latency (clat) percentiles.
| Workload (fio) | Configuration | IOPS (median) | BW (MiB/s, median) | lat p50 (ms) | lat p95 (ms) | lat p99 (ms) | CPU steal (%, median) | CPU iowait (%, median) |
|---|---|---|---|---|---|---|---|---|
| randread 4k, iodepth=32 | vps_small | 17,800 | 69.5 | 0.352 | 1.630 | 3.821 | 3.884 | — |
| randread 4k, iodepth=32 | vps_medium | 64,234 | 250.9 | 0.203 | 0.963 | 2.217 | 1.876 | — |
| randread 4k, iodepth=32 | vps_premium | 90,128 | 352.1 | 0.151 | 0.631 | 1.311 | 0.623 | — |
| randread 4k, iodepth=32 | ded_small | 156,443 | 611.1 | 0.121 | 0.465 | 0.879 | 0.043 | — |
| randread 4k, iodepth=32 | ded_large | 261,811 | 1022.7 | 0.100 | 0.412 | 0.781 | 0.024 | — |
| randwrite 4k, iodepth=32 | vps_small | 12,606 | 49.2 | 0.457 | 2.233 | 5.703 | 3.463 | — |
| randwrite 4k, iodepth=32 | vps_medium | 45,396 | 177.3 | 0.283 | 1.318 | 3.091 | 1.837 | — |
| randwrite 4k, iodepth=32 | vps_premium | 71,426 | 279.0 | 0.202 | 0.850 | 1.763 | 0.648 | — |
| randwrite 4k, iodepth=32 | ded_small | 120,956 | 472.5 | 0.161 | 0.622 | 1.188 | 0.048 | — |
| randwrite 4k, iodepth=32 | ded_large | 201,886 | 788.6 | 0.141 | 0.569 | 1.087 | 0.033 | — |
| randwrite 4k + fsync, iodepth=1 | vps_small | 556 | 2.2 | 2.048 | 18.373 | 60.267 | 3.673 | 11.339 |
| randwrite 4k + fsync, iodepth=1 | vps_medium | 880 | 3.4 | 1.021 | 9.378 | 34.889 | 1.746 | 7.361 |
| randwrite 4k + fsync, iodepth=1 | vps_premium | 1,438 | 5.6 | 0.606 | 3.255 | 9.046 | 0.705 | 3.135 |
| randwrite 4k + fsync, iodepth=1 | ded_small | 2,225 | 8.7 | 0.402 | 1.538 | 2.865 | 0.053 | 1.552 |
| randwrite 4k + fsync, iodepth=1 | ded_large | 2,605 | 10.2 | 0.351 | 1.224 | 2.145 | 0.025 | 1.047 |
Interpretation: the fsync profile (bottom five rows) is the most revealing for shared environments, because synchronous writes expose tail latency due to queueing, background activity, and shared contention—consistent with the “rare spikes” thesis for service quality.
Figure 1 (simulated): CDF of disk latency (fsync write).
Figure 2 (simulated): 4-hour time series of p99 fsync-write latency.
Network results — simulated, medians across 10 runs
Table 2. RTT and iperf3 metrics (simulated; medians across 10 runs). Ping percentiles p50/p95/p99 are used to capture jitter and tail RTT, and iperf3 JSON output supports programmatic aggregation.
| Metric | vps_small | vps_medium | vps_premium | ded_small | ded_large |
|---|---|---|---|---|---|
| ping RTT p50 (ms) | 0.904 | 0.804 | 0.703 | 0.601 | 0.551 |
| ping RTT p95 (ms) | 2.651 | 2.084 | 1.543 | 1.222 | 1.010 |
| ping RTT p99 (ms) | 5.043 | 3.516 | 2.323 | 1.718 | 1.339 |
| iperf3 TCP throughput (Gbps, median) | 0.860 | 0.962 | 1.264 | 0.903 | 9.113 |
| iperf3 TCP retransmits (median, per 60s) | 161 | 119 | 76 | 60 | 27 |
| CPU steal during network test (%, median) | 3.227 | 2.139 | 0.662 | 0.052 | 0.036 |
Practical interpretation: in multi-tenant infrastructure, it is insufficient to report bandwidth alone; p95/p99 RTT and jitter (tail behavior) matter because they affect “chattiness” of distributed services (many short RPCs/requests).
Figure 3 (simulated): CDF of ping RTT.
Statistical analysis
Metrics and formulas
Latency percentiles. For an observed latency sample ( {x_1,\dots,x_n} ), the (p)-th percentile (Q_p) is the value such that approximately (p%) of observations are (\le Q_p). In practice, percentiles are computed by a defined quantile estimator (report which implementation is used).
IOPS and bandwidth relationship. For fixed block size (b) (bytes), the relationship is:
[ \text{BW} \approx \text{IOPS} \times b ] or equivalently
[ \text{IOPS} \approx \frac{\text{BW}}{b} ] When BW is reported in MiB/s and (b) in bytes, unit conversion is required.
Hypothesis testing methodology (bootstrapping + nonparametric test)
The protocol uses:
- Percentile bootstrap for the difference of medians (e.g., ( \Delta = \text{median}(p99)_A – \text{median}(p99)_B )).
- Resample each group with replacement (B) times (e.g., (B=10{,}000)), compute (\Delta^{(b)}).
- The 95% confidence interval is ([\Delta_{2.5%}, \Delta_{97.5%}]).
- Mann–Whitney U test (two-sample rank test) as a nonparametric test of distributional shift (“tends to be larger”). Report: p-value and a probabilistic dominance interpretation (MW parameter).
- Effect size: Cliff’s delta (dominance). A convenient interpretation is:
[ \delta = P(X>Y) – P(X<Y) ] where (X) comes from group A and (Y) from group B.
Example statistical results (simulated)
Table 3. Comparison using 10 independent runs (simulated). Reported: Δ median, bootstrap CI, bootstrap p-value, Mann–Whitney p-value, MW probabilistic dominance ( \varphi ), and Cliff’s delta ( \delta ).
| Comparison | Metric | median(A) | median(B) | Δ median(A−B) | 95% bootstrap CI for Δ | p_bootstrap | p_MW | MW ϕ | Cliff’s δ |
|---|---|---|---|---|---|---|---|---|---|
| vps_medium vs ded_small | fsync lat p99 (ms) | 34.889 | 2.865 | 32.025 | [31.073; 32.558] | 4.00e-05 | 1.83e-04 | 1.000 | 1.000 |
| vps_premium vs ded_small | fsync lat p99 (ms) | 9.046 | 2.865 | 6.181 | [6.070; 6.934] | 4.00e-05 | 1.83e-04 | 1.000 | 1.000 |
| vps_medium vs ded_small | RTT p99 (ms) | 3.516 | 1.718 | 1.798 | [1.746; 1.843] | 4.00e-05 | 1.83e-04 | 1.000 | 1.000 |
| vps_medium vs vps_premium | CPU steal (%, fsync) | 1.746 | 0.705 | 1.041 | [0.751; 1.540] | 4.00e-05 | 1.83e-04 | 1.000 | 1.000 |
Interpretation of MW ϕ and Cliff’s δ: both are dominance-style measures; values close to 1 indicate strong separation where group A tends to produce higher values than group B (here: higher latency or higher steal).
Discussion and threats to validity
Why tail latency matters more than averages
For many online services, “rare” slow events become a material fraction of user-visible requests at scale (tail-at-scale effect). Variability sources—queues, background activity, shared-resource contention—are difficult to eliminate entirely.
Why I/O often breaks predictability first
In multi-tenant infrastructure, shared storage and shared services are prone to interference and higher variability. Databases are particularly sensitive to disk behavior: interference and contention translate into application-level response-time variance and SLA degradation.
%steal as a VPS differentiator
Steal time is CPU time needed by the guest but not provided by the host because resources were allocated elsewhere; it is observable in /proc/stat and standard monitoring tools.
Operationally: if tail latency and %steal rise together while guest CPU load appears “normal,” the bottleneck is likely host-level CPU contention (typical under oversubscription). This is a concrete engineering input for choosing between shared VPS, “guaranteed” VPS, and Dedicated.
Limitations and threats to validity
Simulated results vs live measurements. The Results values are not tied to any specific data center; they demonstrate reporting structure and typical effects from the literature (tail variability, multi-tenant interference, and %steal diagnostic value).
Instrumentation validity. fio percentile computation depends on internal accounting and can vary with logging/aggregation mode; therefore, live studies should fix fio version, output format (JSON), and preserve raw artifacts.
Construct validity (synthetic vs production). fio/sysbench/iperf3/pgbench capture important aspects but do not replace profiling of real applications; they remain useful as “minimal reproducible” tests for comparing infrastructure classes.
External validity (transferability). Results from one region/storage class/network may not transfer to others; multi-tenant background noise varies over time, so tests should be repeated in different time windows and reported via distributions/percentiles rather than single numbers.
Practical recommendations, decision checklist, conclusion, and appendix
Practical recommendations (SLO/risk language)
- If the target service is IO-bound (databases, logs, queues with fsync, heavy writes), the key KPI is p99 latency under
randwrite+fsync. For stable p99 requirements, Dedicated or premium VPS with explicit CPU/I/O guarantees is often justified. - If the service is CPU-bound (rendering, compilation, pure compute, high-QPS processing), diagnose %steal: persistent steal indicates shared-host CPU contention and supports choosing a guaranteed profile or Dedicated.
- If the service is network-bound (proxy/edge, highly “chatty” microservices), publish p95/p99 RTT and jitter plus iperf3 throughput/retransmits because network tail latency degrades distributed-system behavior.
Decision checklist (engineering questions to ask)
- CPU: oversubscription constraints/guarantees, CPU pinning/“guaranteed vCPU,” typical %steal for the SLA class.
- Storage: local NVMe vs shared pool, QoS for IOPS/latency, availability of latency metrics/graphs.
- Network: port speed (1G/10G), rate-limit/PPS policy, expected p95/p99 RTT intra-region, isolation guarantees.
- Observability: permission to run sysstat tooling and collect iostat/sar/pidstat; constraints on benchmarking.
Conclusion
A journal-style VPS vs Dedicated publication should be centered on latency distributions and their sources: tail latency (p95/p99) and temporal variability are more informative than averages, while multi-tenant interference and CPU contention can be diagnosed via system metrics such as %steal.
The proposed protocol (repeats + long runs + telemetry + bootstrap/Mann–Whitney analysis) enables reproducible and comparable reporting across tariff classes without tying conclusions to specific providers.
Appendix: reproducibility pack (bash) and table templates with filled examples
Below is a minimal bash command set to reproduce the protocol on any Linux host; parameters are explicit. Percentile interpretation follows fio documentation and standard “X% of operations complete within ≤ value” semantics.
Environment preparation
bash# OS: Ubuntu/Debian (example)
sudo apt-get update
sudo apt-get install -y fio sysbench iperf3 postgresql-contrib sysstat procps

# Record OS and tool versions for the protocol
uname -a
lsb_release -a || cat /etc/os-release
fio --version
sysbench --version
iperf3 --version
pgbench --version

# CPU governor
for c in /sys/devices/system/cpu/cpu*/cpufreq/scaling_governor; do
  echo performance | sudo tee "$c"
done

# I/O scheduler: inspect and (if needed) set
lsblk -d -o NAME,ROTA,TYPE,SIZE,MODEL
cat /sys/block/nvme0n1/queue/scheduler 2>/dev/null || true
echo none | sudo tee /sys/block/nvme0n1/queue/scheduler 2>/dev/null || true
fio short runs (60s × 10 repeats)
bash
TARGET_DIR=/mnt/bench
mkdir -p "$TARGET_DIR"

# 1) randread 4k, iodepth=32
fio --name=randread4k \
  --directory="$TARGET_DIR" --filename=fiofile \
  --rw=randread --bs=4k --iodepth=32 --numjobs=1 \
  --direct=1 --size=4G --runtime=60 --time_based \
  --group_reporting --output-format=json \
  > fio_randread4k.json

# 2) randwrite 4k, iodepth=32
fio --name=randwrite4k \
  --directory="$TARGET_DIR" --filename=fiofile \
  --rw=randwrite --bs=4k --iodepth=32 --numjobs=1 \
  --direct=1 --size=4G --runtime=60 --time_based \
  --group_reporting --output-format=json \
  > fio_randwrite4k.json

# 3) randwrite 4k + fsync, iodepth=1
fio --name=fsyncwrite4k \
  --directory="$TARGET_DIR" --filename=fiofile \
  --rw=randwrite --bs=4k --iodepth=1 --numjobs=1 \
  --direct=1 --fsync=1 --size=2G --runtime=60 --time_based \
  --group_reporting --output-format=json \
  > fio_fsyncwrite4k.json
Long run (recommended 4h) + telemetry
bash
# 1-second telemetry (example)
iostat -x 1 > iostat_1s.log &
IOSTAT_PID=$!
vmstat 1 > vmstat_1s.log &
VMSTAT_PID=$!
sar -u -r -d 1 > sar_1s.log &
SAR_PID=$!

# 4 hours = 14400 seconds
fio --name=fsyncwrite4k_long \
  --directory="$TARGET_DIR" --filename=fiofile \
  --rw=randwrite --bs=4k --iodepth=1 --numjobs=1 \
  --direct=1 --fsync=1 --size=2G --runtime=14400 --time_based \
  --group_reporting --output-format=json \
  > fio_fsyncwrite4k_4h.json

kill $IOSTAT_PID $VMSTAT_PID $SAR_PID
Network (iperf3 + ping)
bash
# On server:
iperf3 -s

# On client:
iperf3 -c <SERVER_IP> -t 60 -J > iperf3_tcp_60s.json
ping -i 0.2 -c 300 <TARGET_IP> > ping_300.log
pgbench (optional, database-class signal)
bash
createdb pgbench
pgbench -i -s 10 pgbench

pgbench -c 10 -j 4 -T 60 -P 10 -l pgbench > pgbench_run1.log
pgbench -c 10 -j 4 -T 60 -r pgbench > pgbench_run1_percmd.log
Table templates (filled example structure, not empty)
Table A1. Host specification report (example layout with the representative configurations used in this paper).
| Parameter | small VPS | medium VPS | premium VPS | dedicated small | dedicated large |
|---|---|---|---|---|---|
| CPU | 1 vCPU (shared) | 2 vCPU (shared) | 4 vCPU (guaranteed) | 4 cores | 8 cores |
| RAM | 2 GB | 4 GB | 8 GB | 16 GB | 32 GB |
| Storage | SSD (SATA class) | NVMe | NVMe + QoS | 1×NVMe | 2×NVMe |
| Network | 1G class | 1G class | 1G class | 1G | 10G |
| OS/kernel | Ubuntu 24.04 / 6.8.x | same | same | same | same |
| Governor | performance | performance | performance | performance | performance |
| I/O scheduler | mq-deadline | none | none | none | none |
Table A2. fio reporting template (example populated with the fsync p99 line from Results).
| Profile | Configuration | IOPS | BW (MiB/s) | clat p50 (ms) | clat p95 (ms) | clat p99 (ms) | %steal | %iowait |
|---|---|---|---|---|---|---|---|---|
| randwrite 4k + fsync qd1 | vps_medium | 880 | 3.4 | 1.021 | 9.378 | 34.889 | 1.746 | 7.361 |
| randwrite 4k + fsync qd1 | ded_small | 2,225 | 8.7 | 0.402 | 1.538 | 2.865 | 0.053 | 1.552 |